UX & growth for a sustainable e‑commerce

Diagnosis

Context

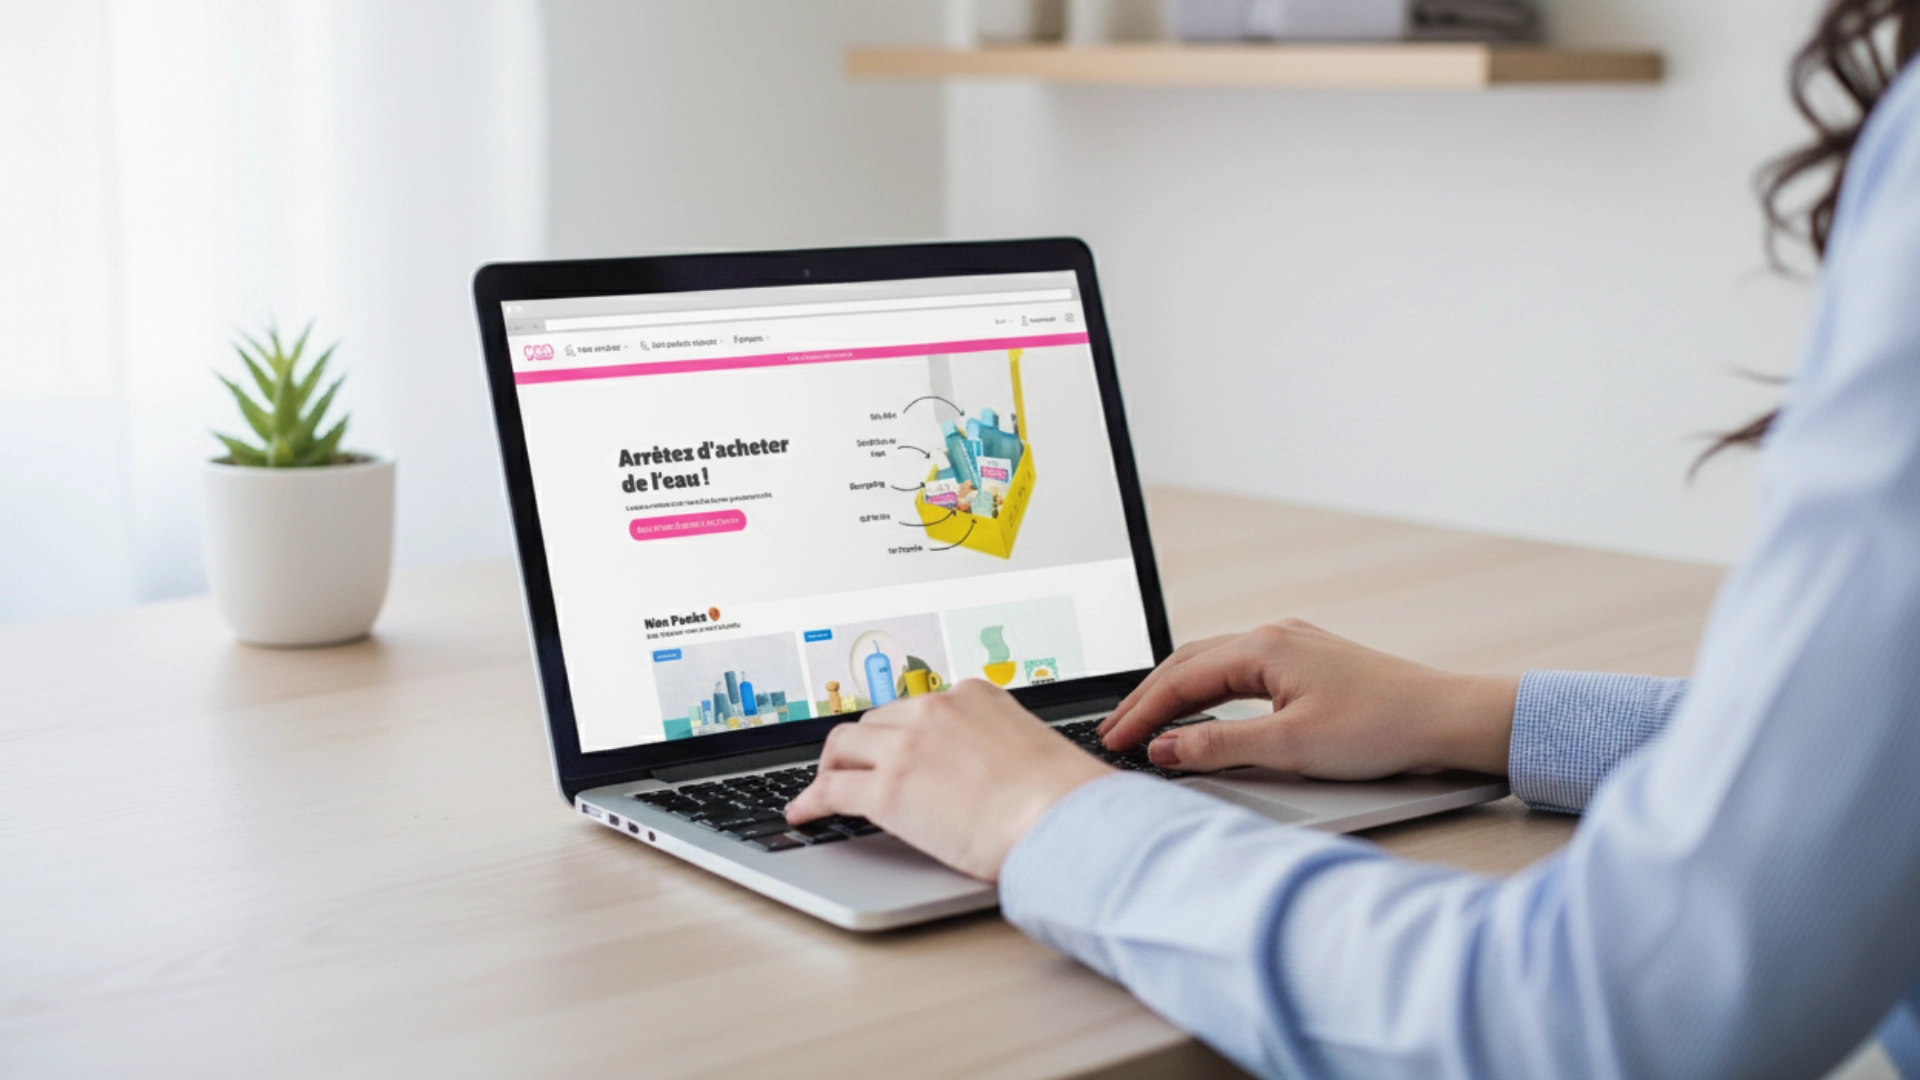
900.care is a D2C startup with a subscription-based business model for homecare and hygiene products. Its profitability strongly depends on the value of the first order to encourage retention and offset the customer acquisition cost (CAC). The homepage and sales funnel were major friction points, not converting visitors efficiently enough and not sufficiently encouraging product range discovery.

Problem

How to design the user journey to stabilize a conversion rate above 5% and increase the average order Value (AOV), all while reinforcing the brand's value proposition?

Context and problem visualization

Role

As a product designer, I was responsible for the entire cycle, from user research to the delivery of the final mockups, working closely with the Product Manager to define the objectives and deploy solutions with the developers team.

Key insights

  • Data analysis (Metabase, Datadog) revealed underperformance in the product discoverability.
  • Qualitative interviews (27 conducted) confirmed cognitive overload, counter-intuitive navigation and an overly extended sales funnel.
  • The fundamental issue was therefore linked to the site's complexity and lack of smart functionalities.
Role and insights visualization

Conception

Methodology

I adopted a data-informed approach. Each design decision was based on a hypothesis derived from user research (qualitative and quantitative). My process included journey mapping (UX mapping), prototyping on Figma, and regular user testing. Collaboration with the product manager and developpers throught sprint planning was essential for quick deliveries.

Design conception

I designed a new homepage structure, prioritizing a clear value proposition and the strategic highlighting of bundles, which generate a higher AOV. I prototyped several low-fidelity versions of ppsell/cross-sell modals for users testing and challenge our hypothesis. The goal was to suggest complementary products smoothly, without interrupting the main purchase path.
Conception visualization

Results

Delivery

We successfully launched the new upsell flow, revamped the homepage, the product catalog and implemented a new section to manage incoming orders. The delivery included fully documented designs, interactive prototypes, an advanced design system update, user insights and reseach protocol.

Metrics

Achieved a +47% increase in Average Basket Value (ABV) and reduced churn by 25% post-launch.
Results visualization